Feature – Intellitrace
My Role – UX Design – UI Design – Data Design
Problem statement
Developers liked having a searchable event log to go through when problems occur. Operations liked finding problems across live running services.
Features kept being added over the years and experience design had not improved over that time.
We wanted to enhance the experience with user input and keep the core features:
– Complete records of data
– Chronological events
– Correlation of events
– Direct access to the code base
What was the current state of the experience?
Hard to find
Intellitrace existed deep inside of menus in Visual Studio.
Hard to use
Log files were huge had a nearly infinite layer of events to comb through.
High cognitive load
Deep tree views, tabbed systems of navigation, and byzantine icons.
Starting at the beginning
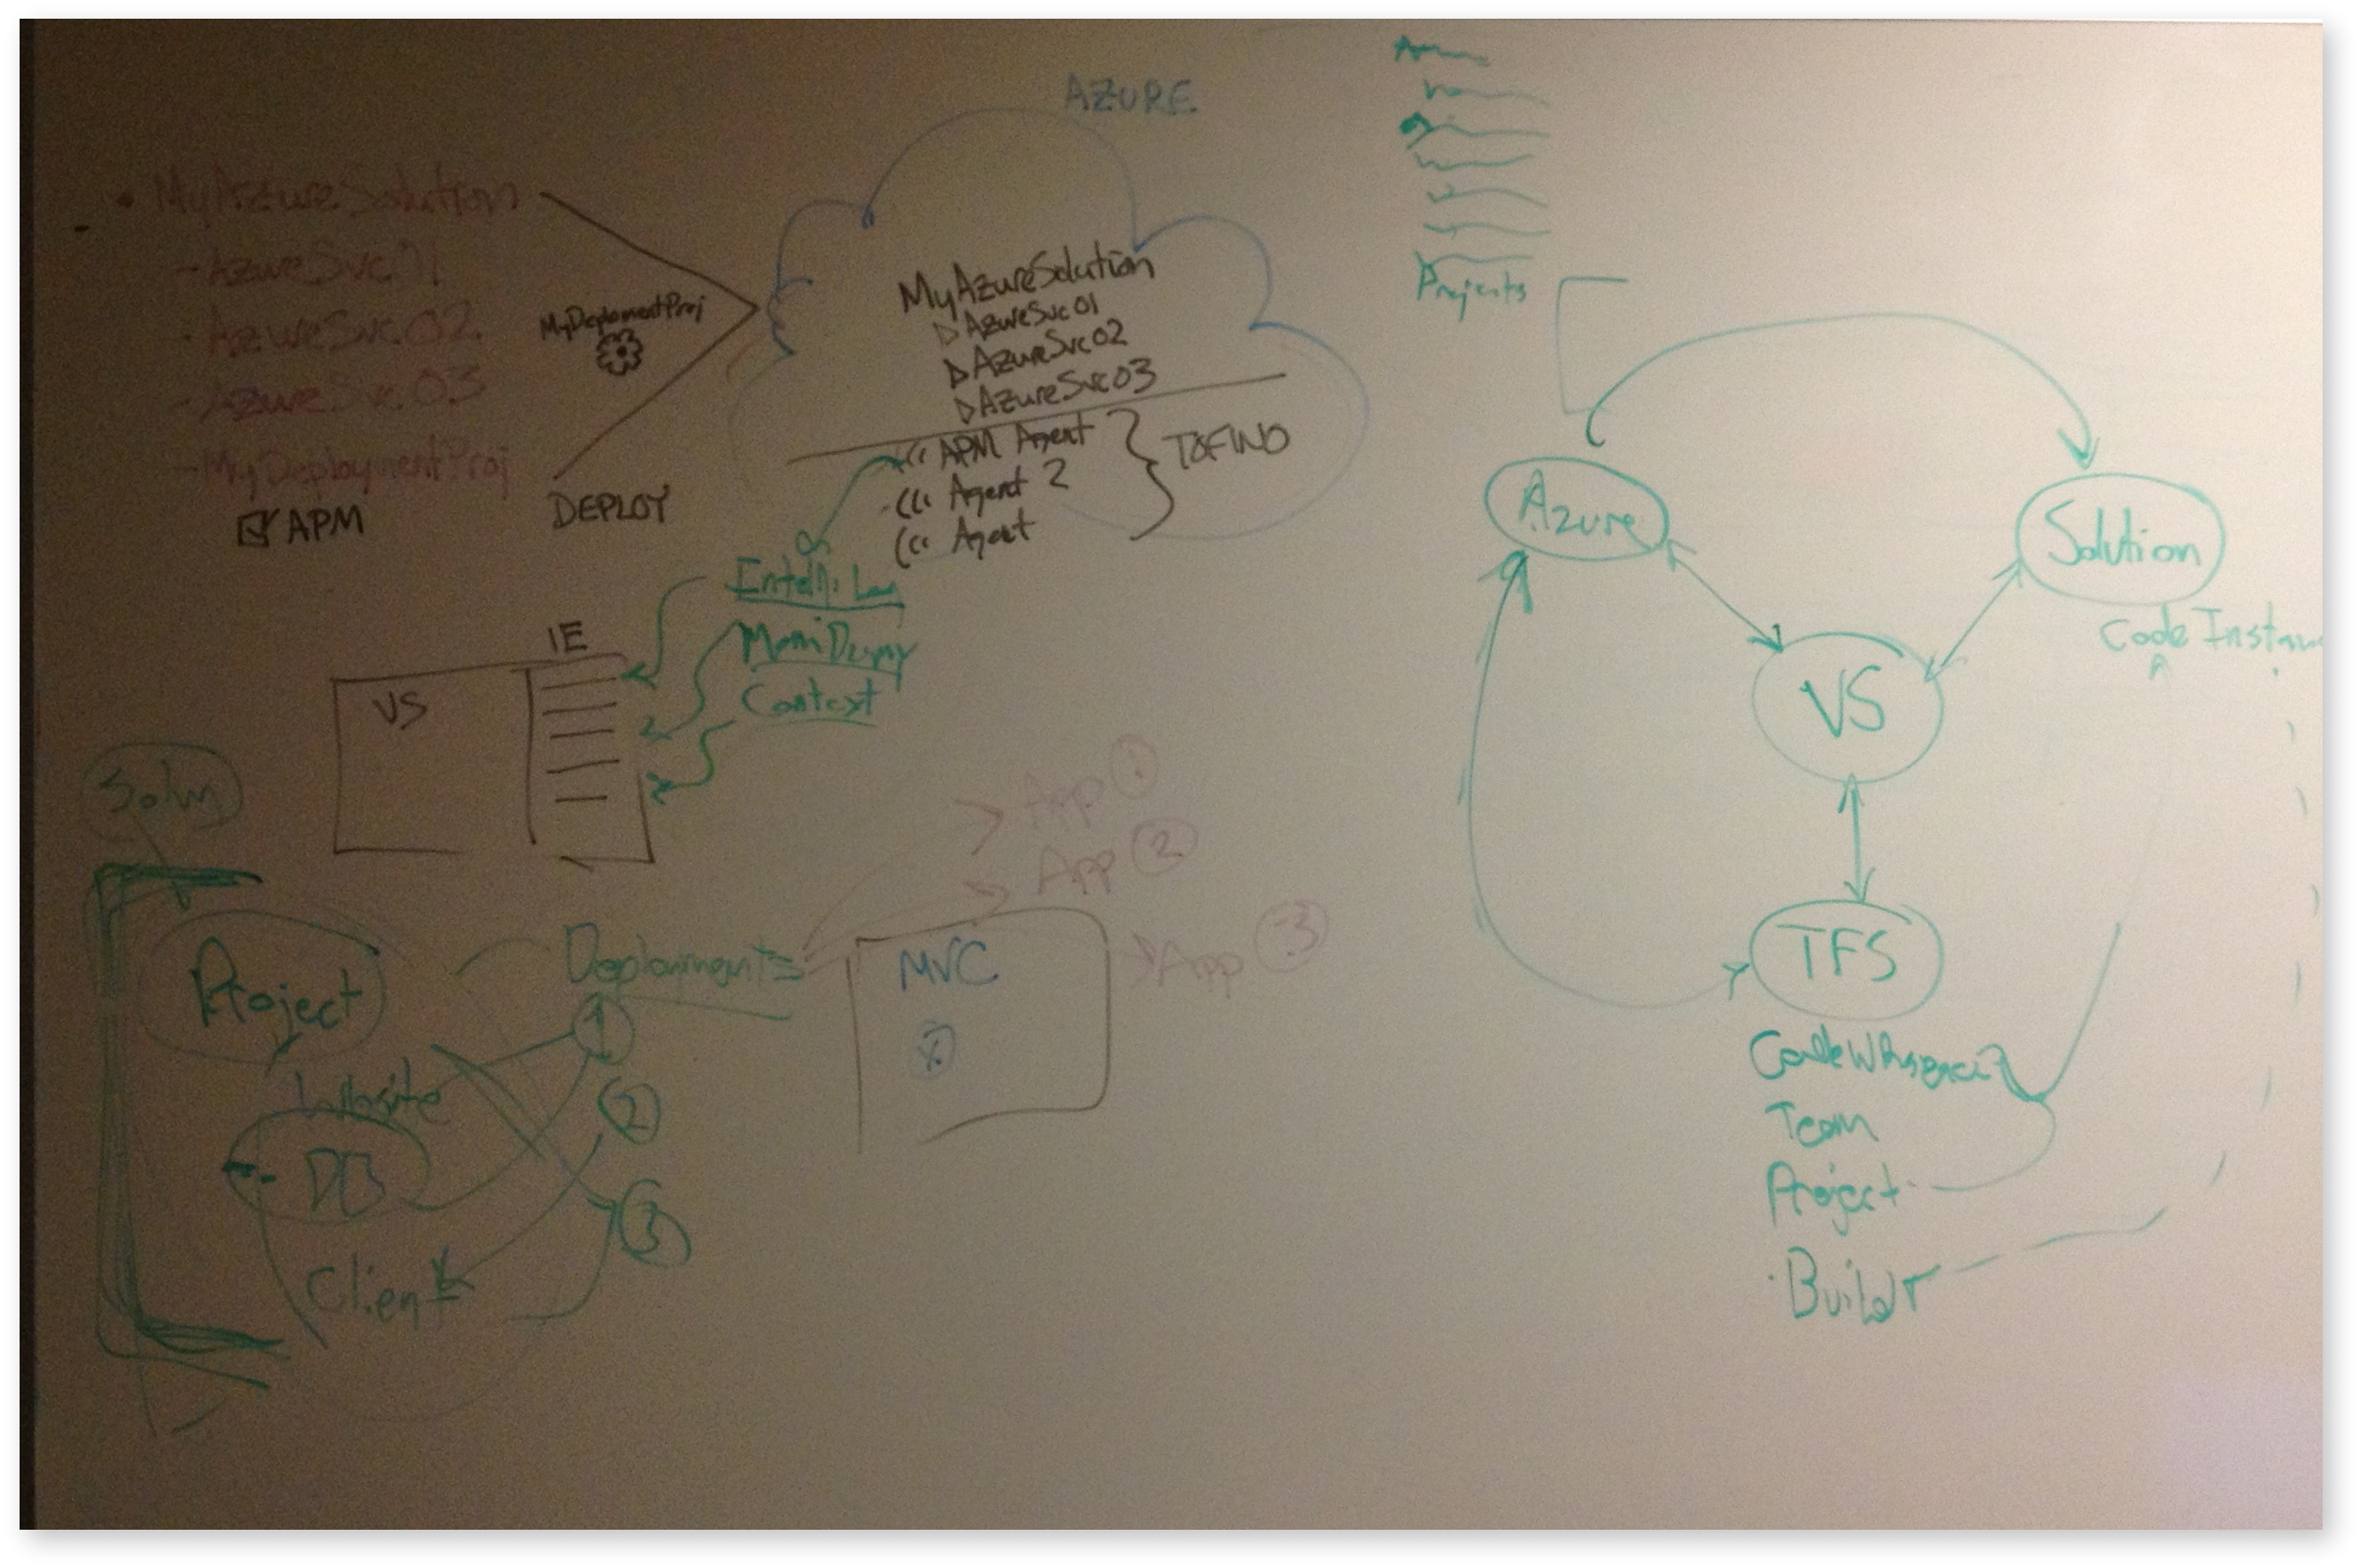
Working with the product and development leads, I started to go through why Intellitrace gets used, how developers think about their product lifecycle, and where Intellitrace fits into that. I discovered it was not one feature, but working with multiple task models in a tool chain. I stated looking at how the interface was not mapping to this mental model.
MVP research focus groups
– Solution providers used Intellitrace to identify bad code.
– Developers fixing legacy services and code.
– Operations users tracking issues across servers.
Questions I had in mind
– How will we enable user to deal with dense information?
– How might we help users get to the code behind an issue?
– Can events be tracked across different versions of software?
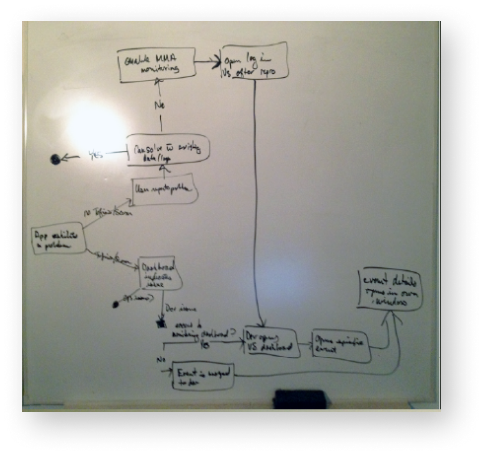
Designing what DevOps meant for Developer Division UX
My team, Developer Division UX, had decades of understanding what developers were looking for in this kind of tooling, but we were seeing an evolution.
Developer and Operations workflows were blurring. Intellitrace was providing the right answers but the experience was getting in the way of finding answer. With my research partner, we came up with a diagram to explain not only the cycle of development but how attention spans varied across activities in it.
This was built on top of core philosophies from Developer Division UX; Build, Measure, Learn.
Experience divergence
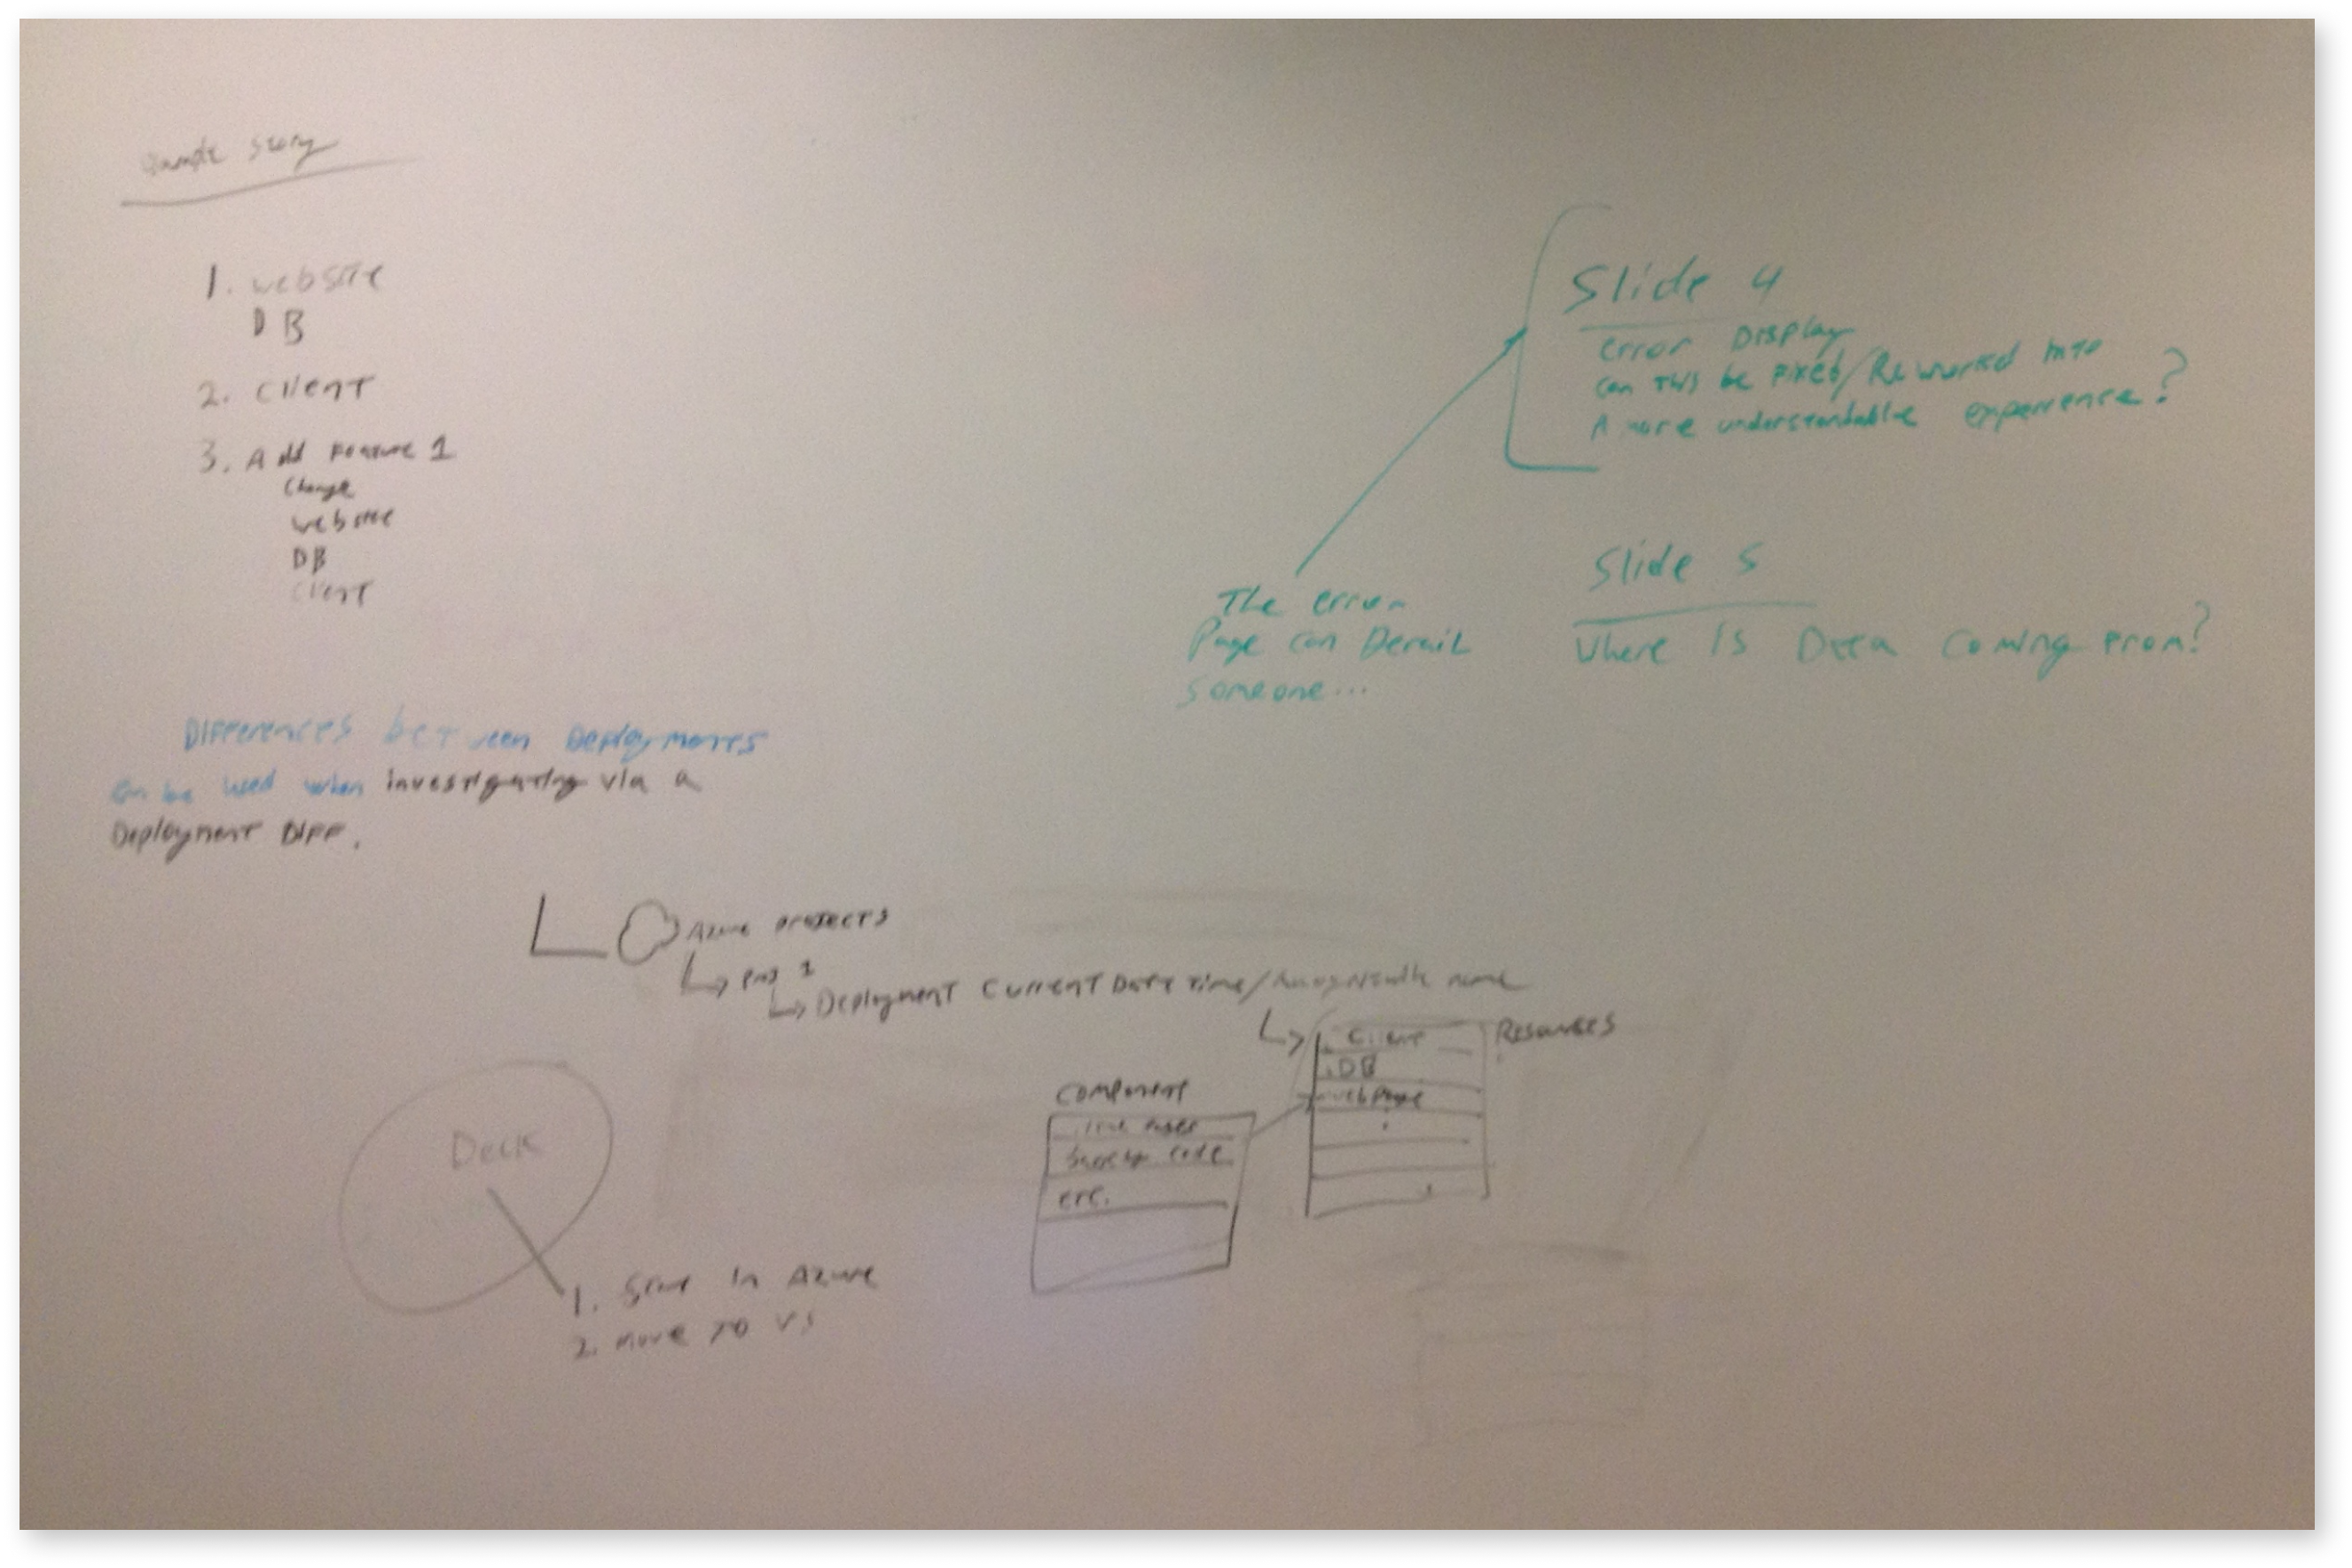
Taking the research highlights to the product owner and development lead, we started to map out a changed workflow. I started working on how the interface would change from a purely sandbox / exploration model into a directed task based model. I felt confident from the research that we could pivot the product into a better competitor by adding in the ability to find trends in the software events.
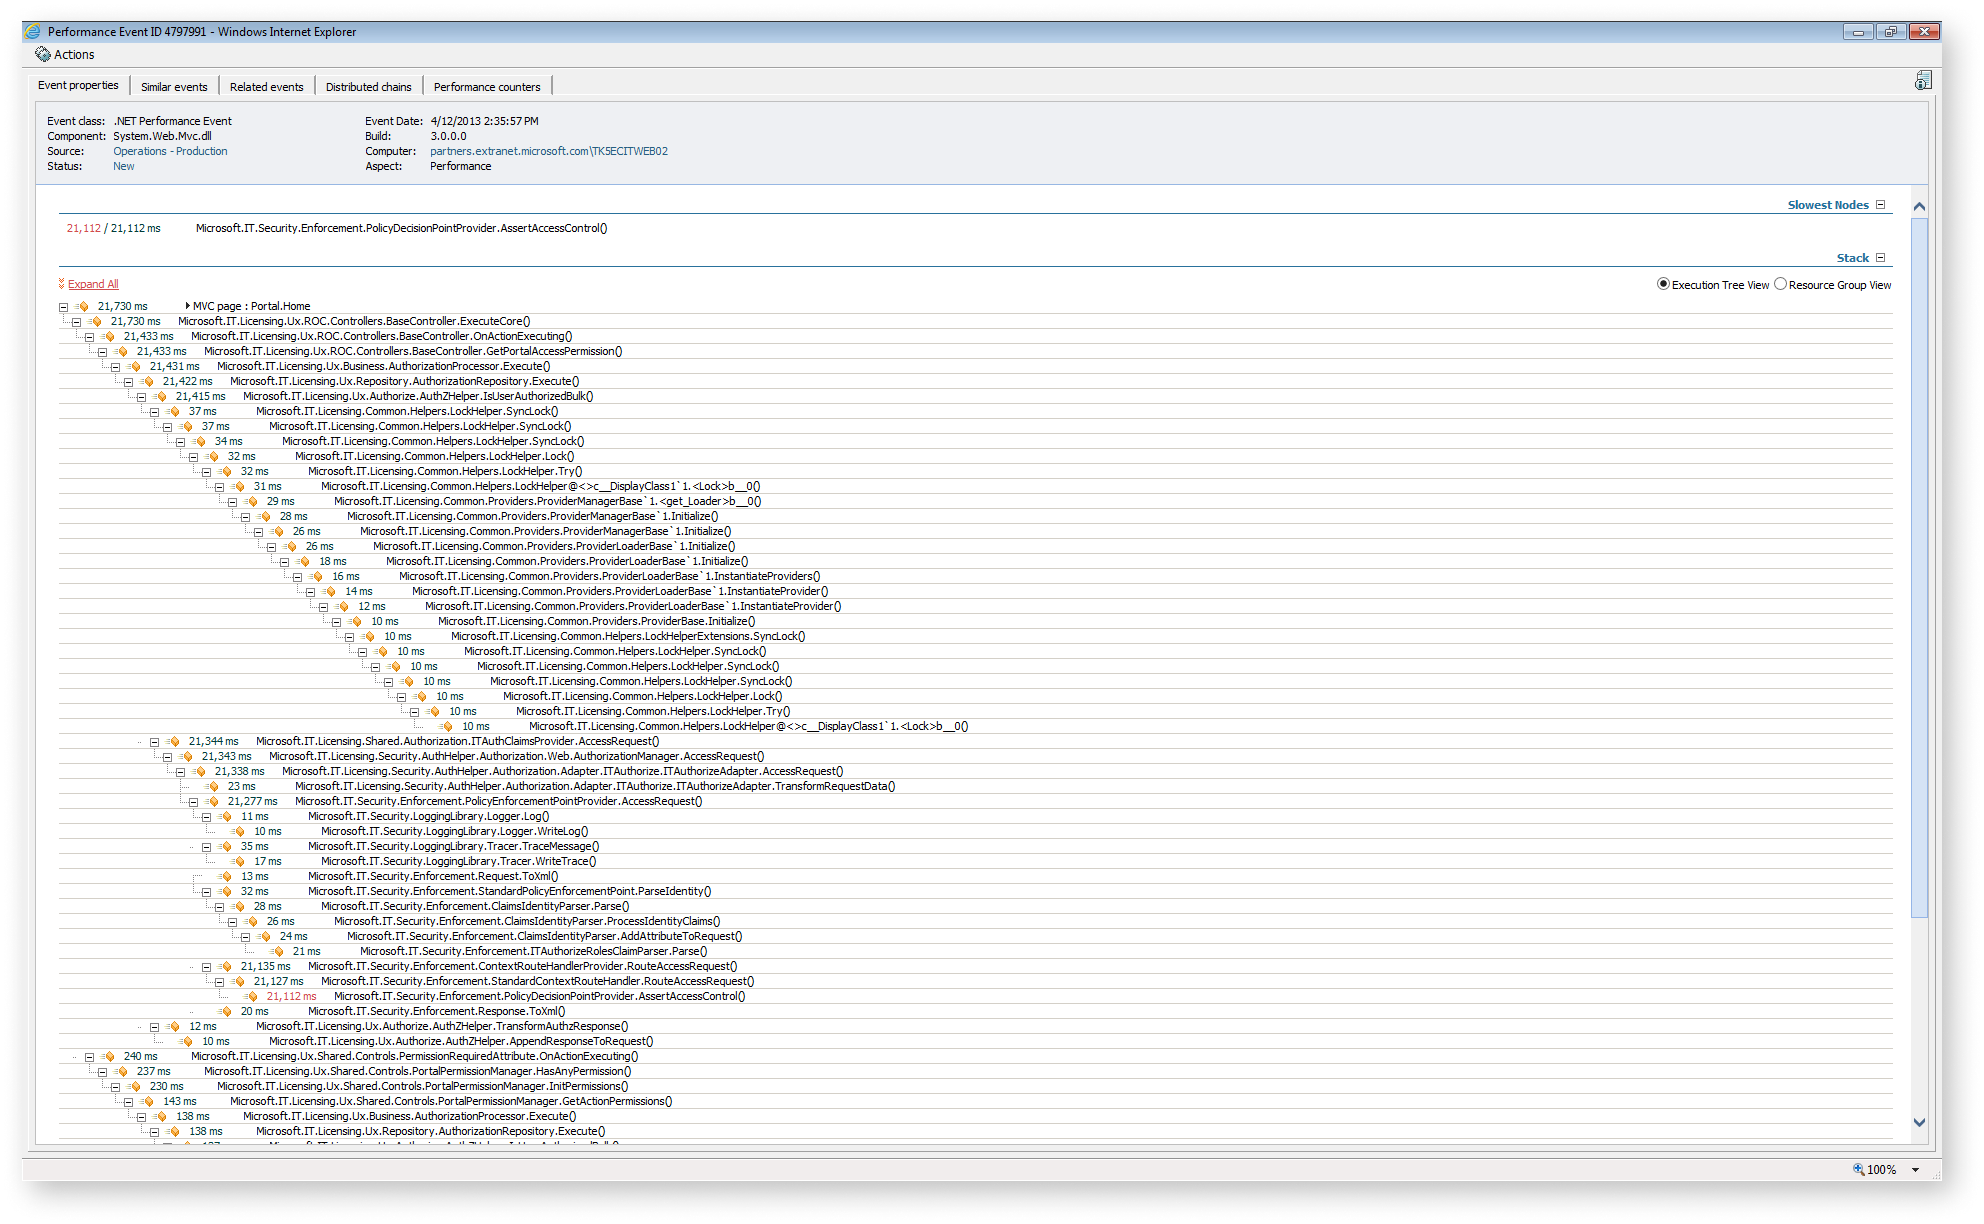
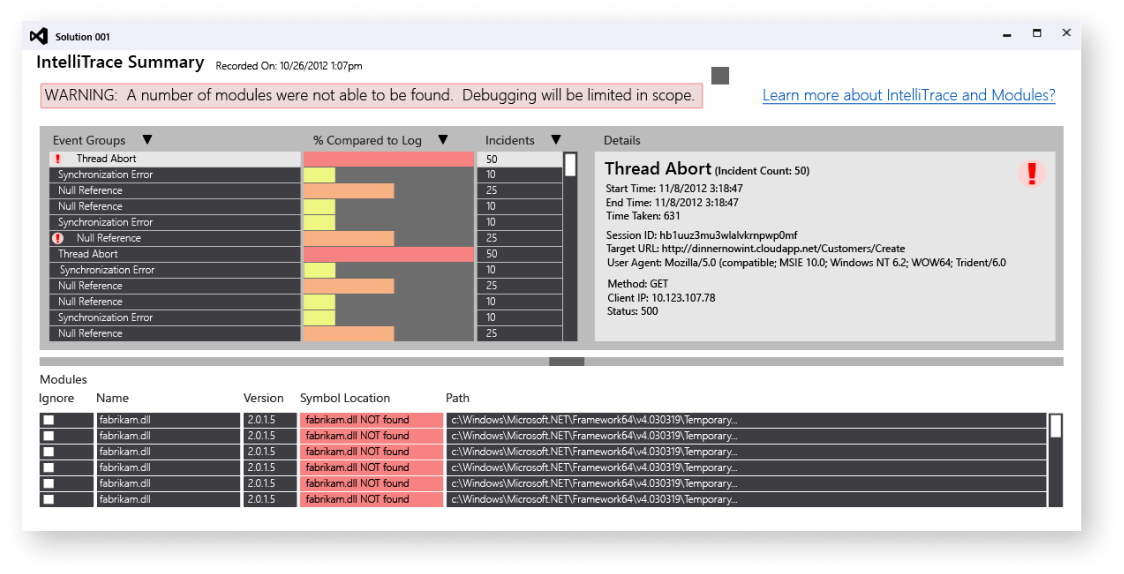
Looking again at the raw event log loaded into Intellitrace, there are a lot of issues:
– How might a user find the root cause of an event?
– What are all of these events?
– What might a user do to spot trends in the event log?
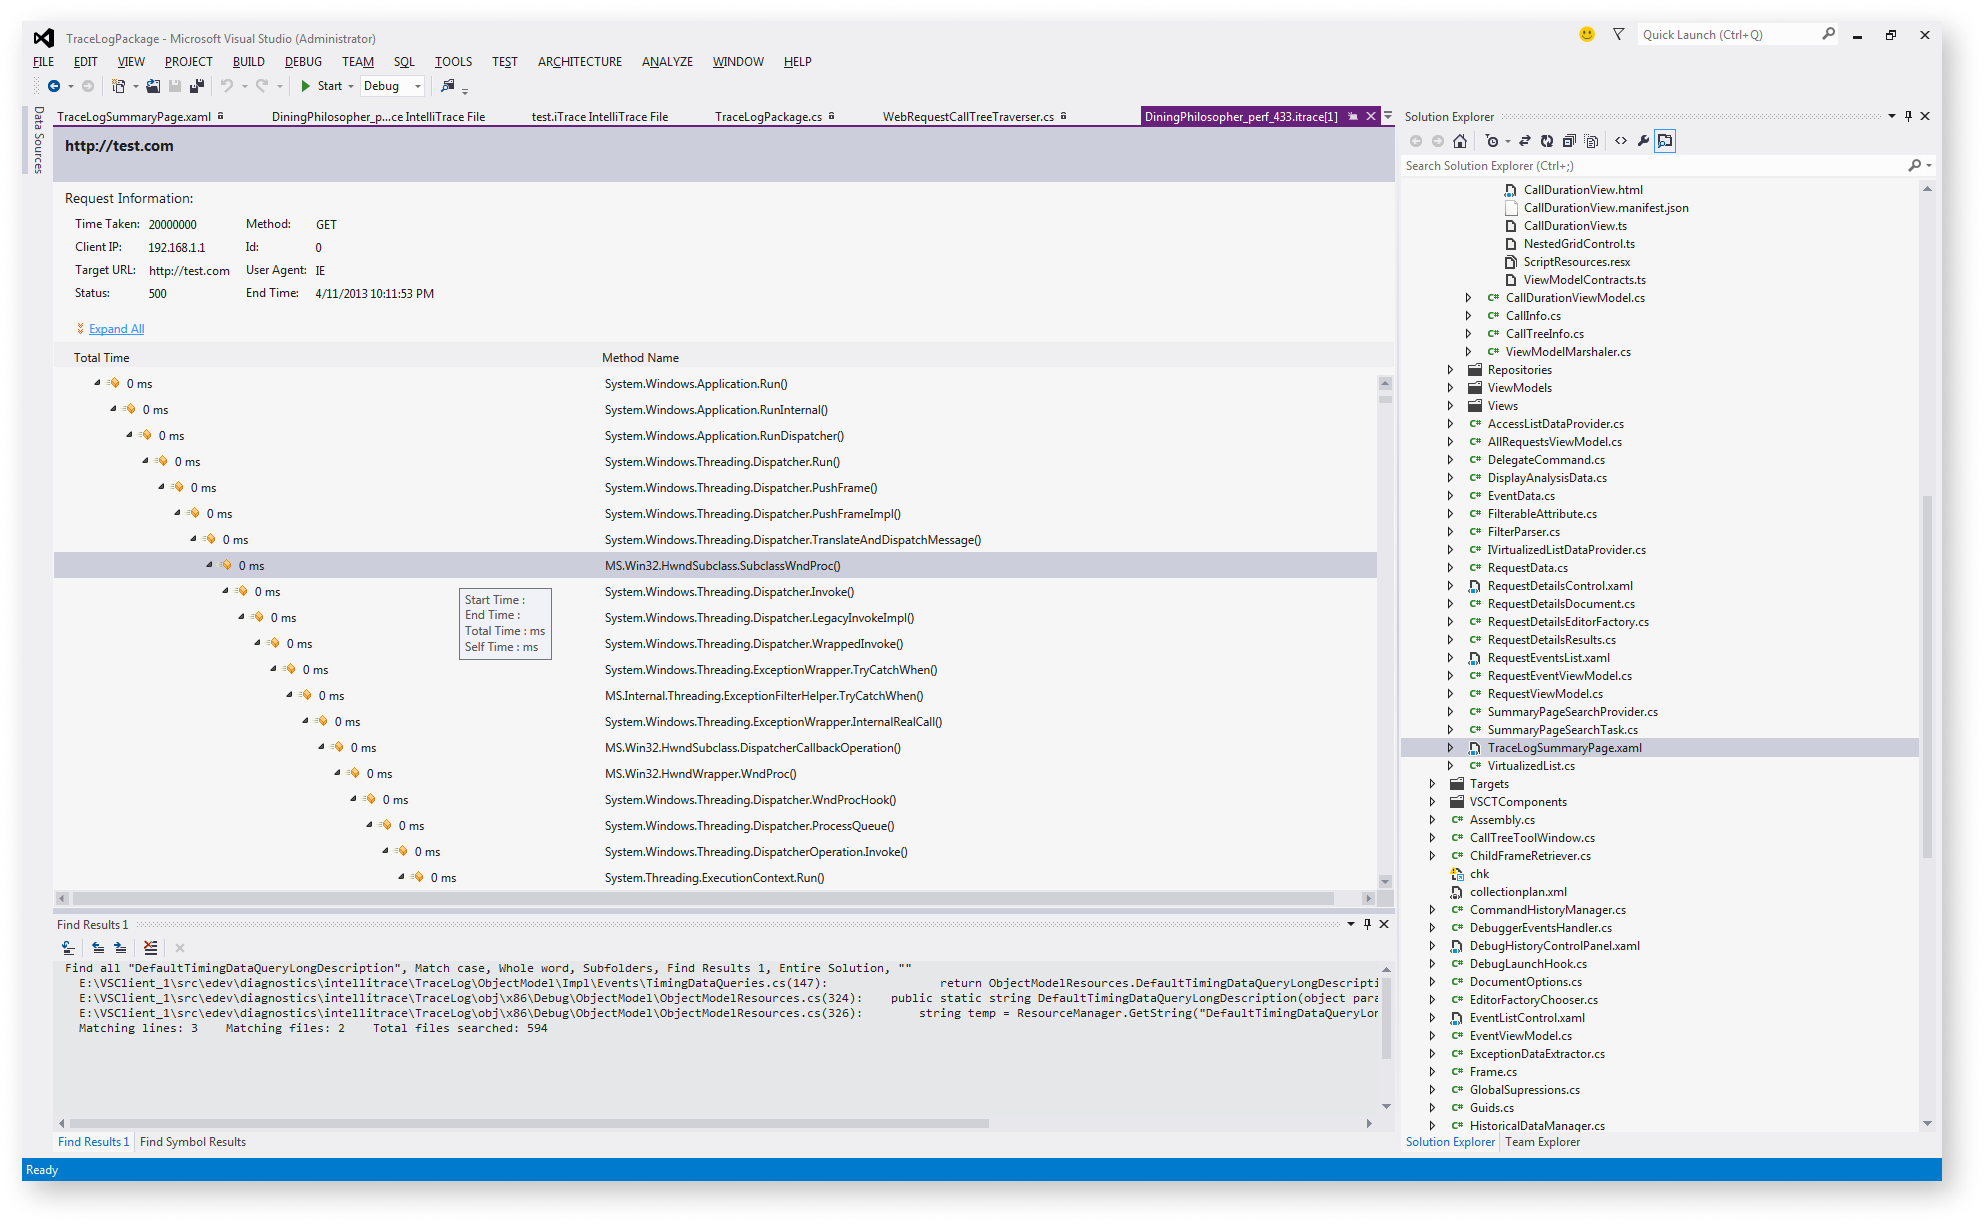
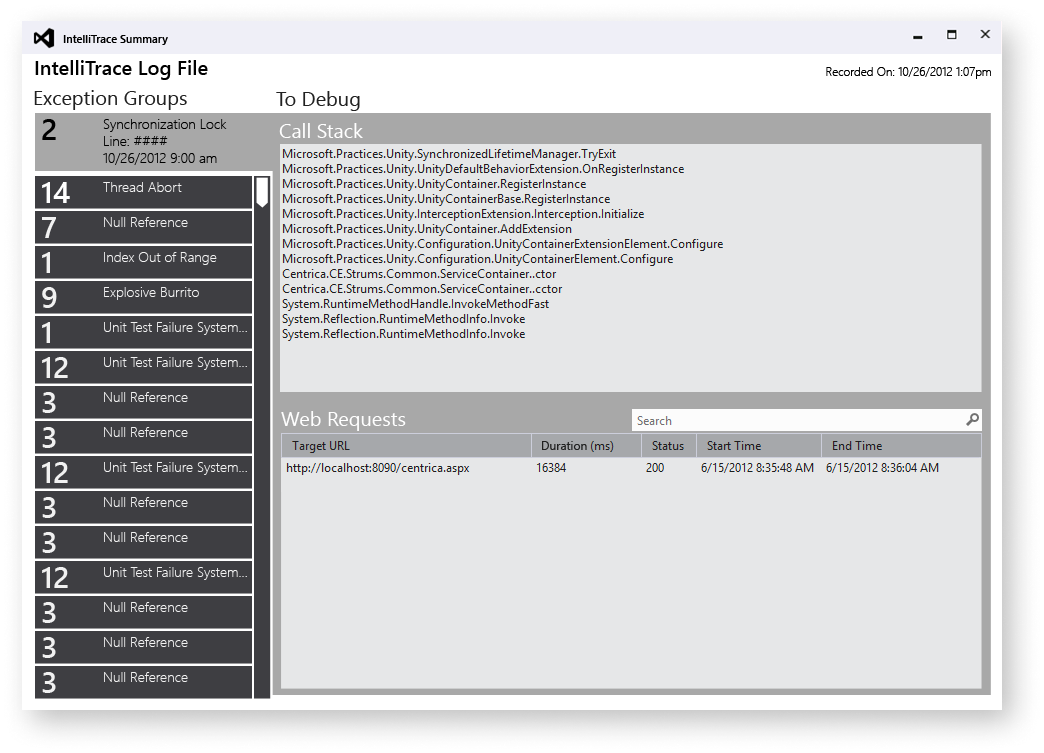
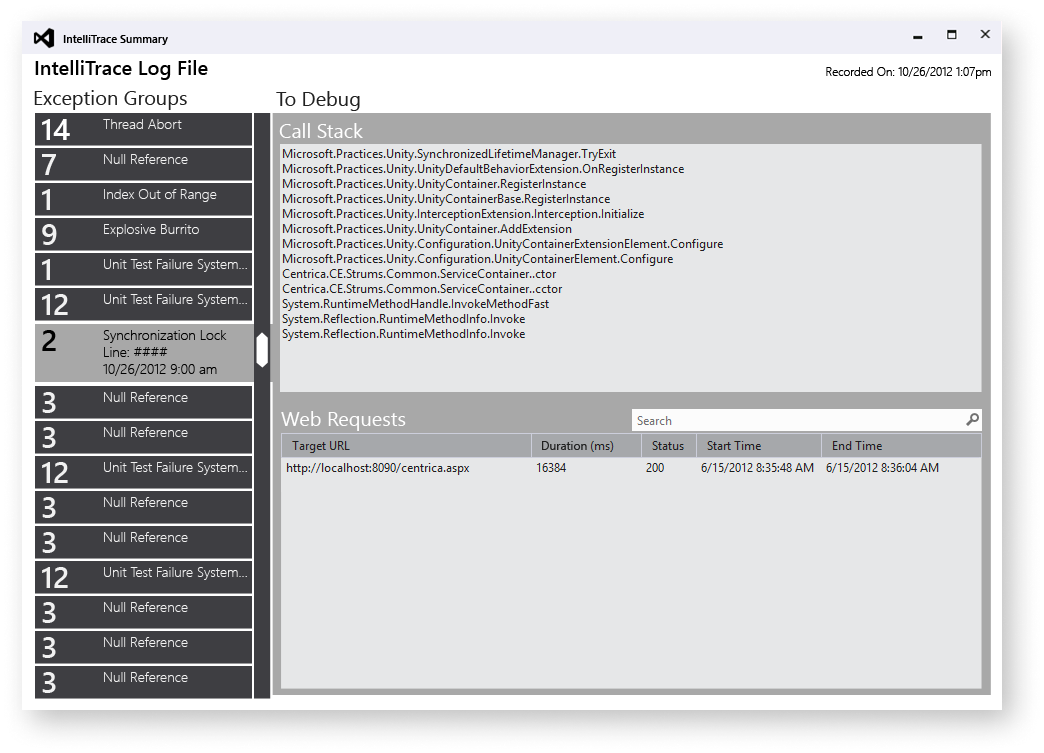
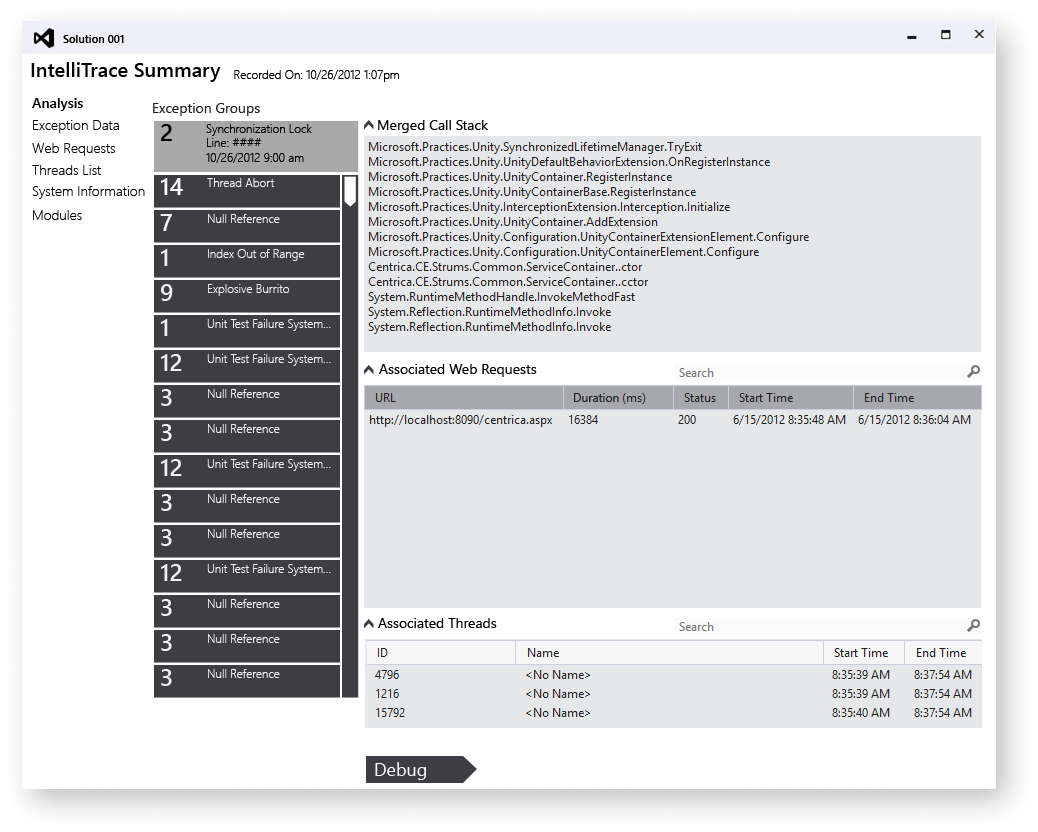
Intellitrace is capable of creating a rough summary grouping of the events that occurred in a session or reading a log file. This was an entirely separate interface, so a user has to use this in one window and hunt down the issues in the other; manually.
I wanted to be able to bring that forward as a grouping and possibly navigation system. Users reported that they will run the analysis to get to this summary as a way to navigate the raw file..

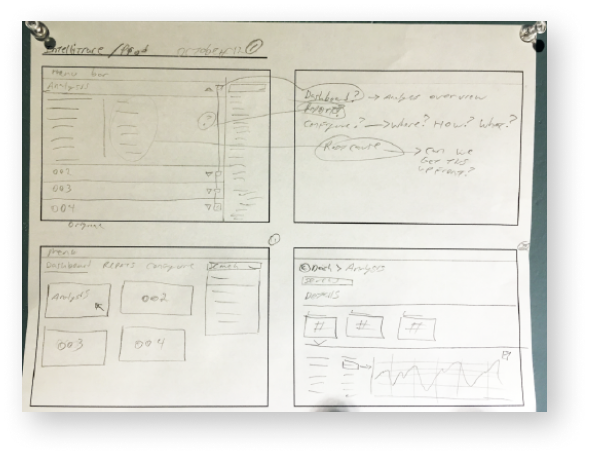
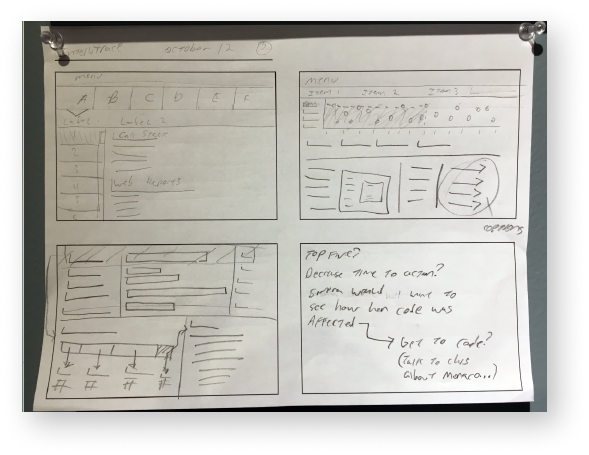
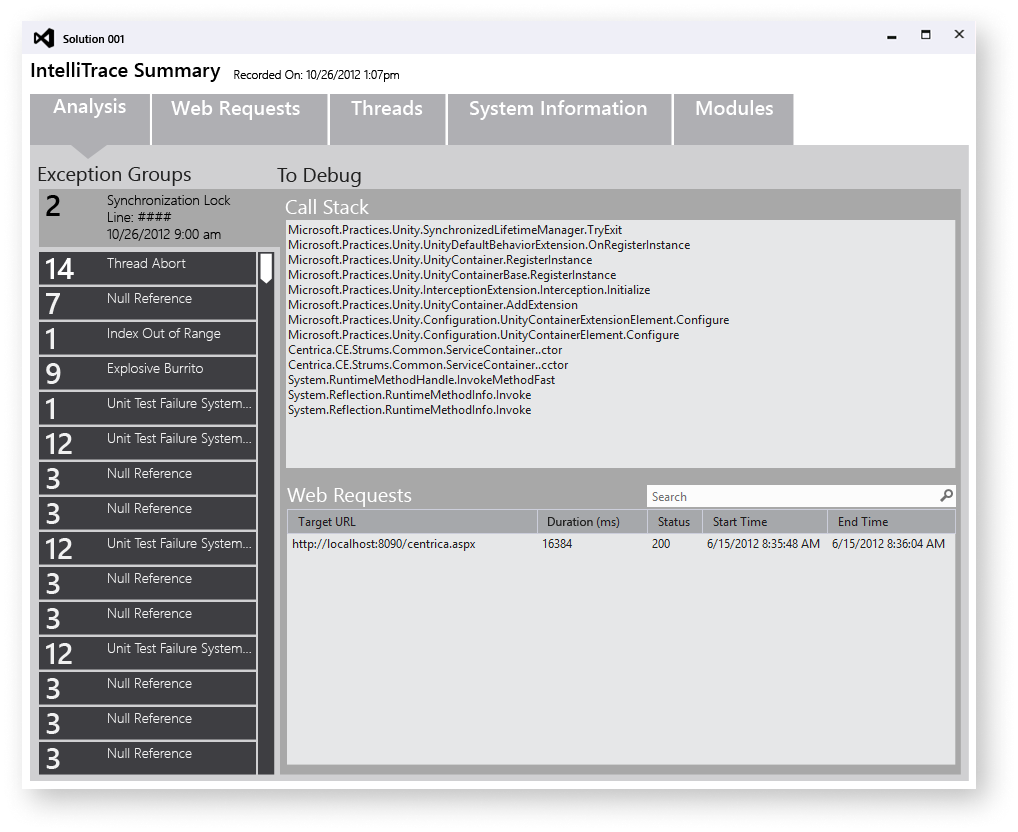
Wireframes
Every two weeks we would refine and get feedback from users. Users were invited to come to our research lab and click through screens with a specific task in mind. I wanted them to talk through the process. These are a few of the hundreds of key frames I used that show the progression of the interface.

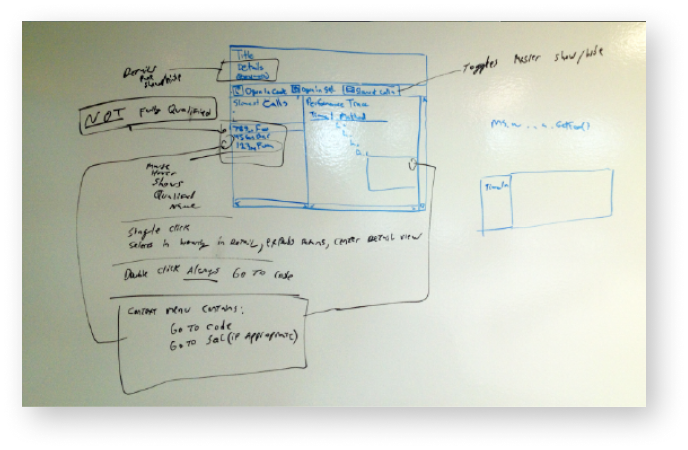
Towards production
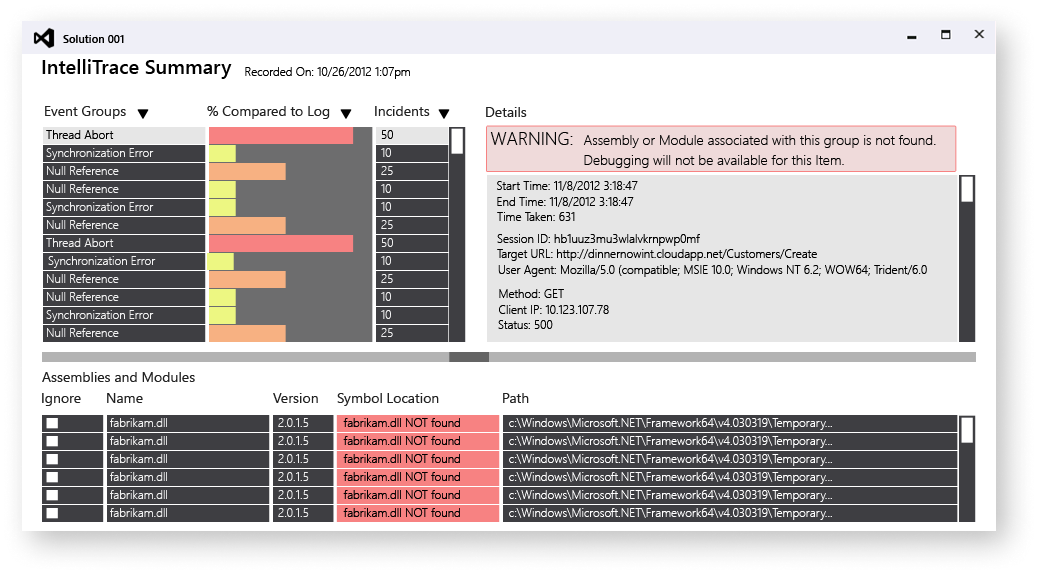
Visualization as a grouping mechanism allows a user to see trends and issues that stick out from the packs of data. We could not give the user the direct answer due to individual needs and circumstance. Instead we built a system of visualization that empowers a user to see events that do not fit the normal trending of the data and angle towards the root cause.

Quickly access events, faceted filtering, and a timeline for event occurrences

‘Similar Occurrences’ use a scatter plot of events that have occurred across multiple times in the log file
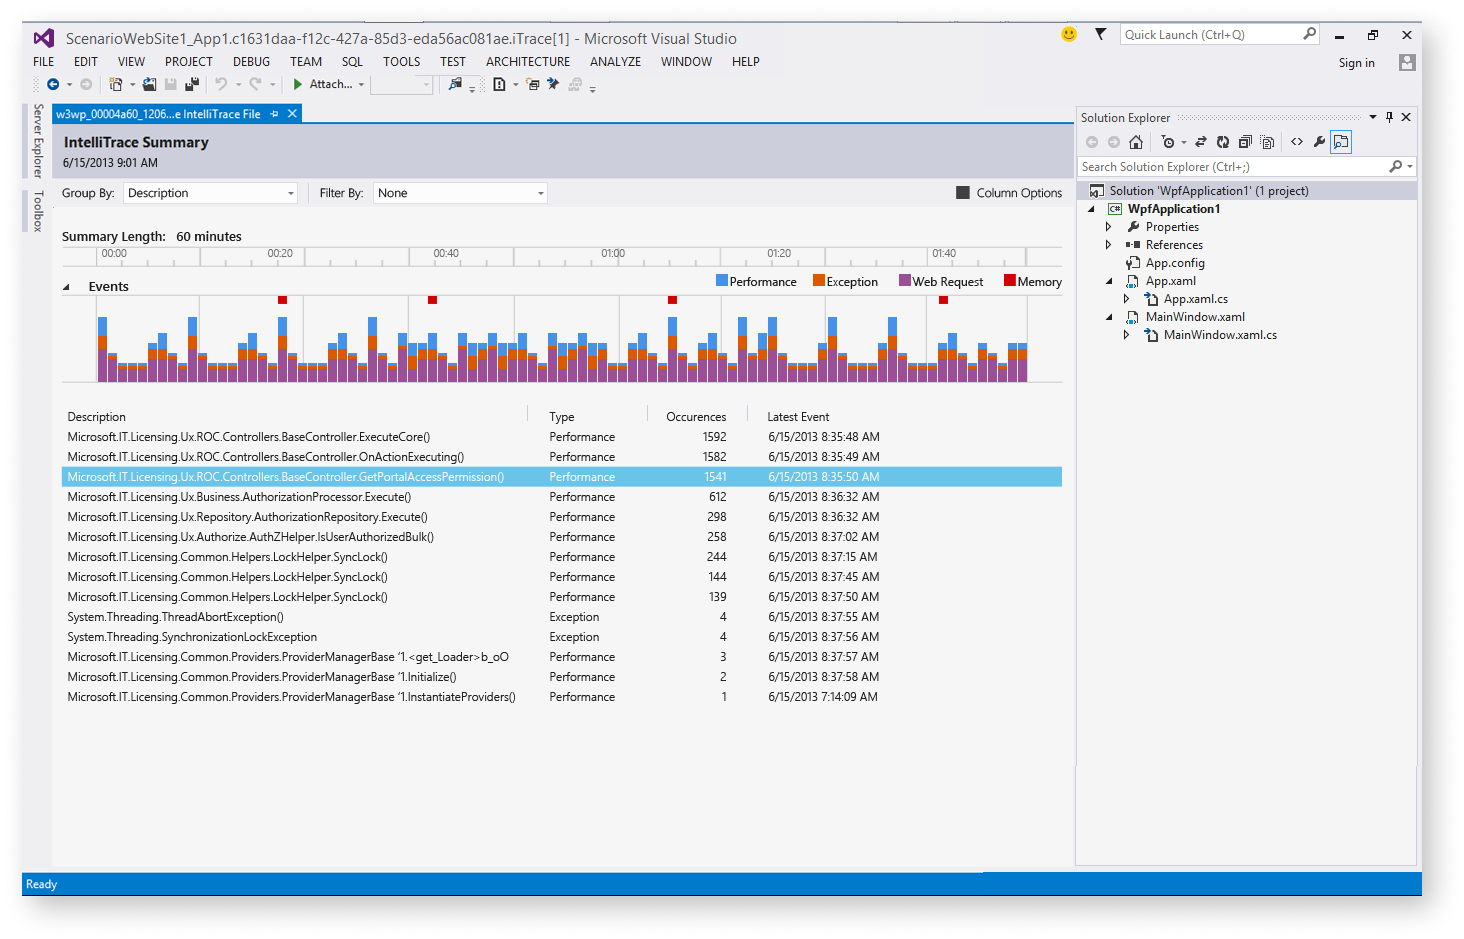
Events experience using a stacked bar chart bucketing events into a more manageable trend visualization